The recent Highpoint to Lowpoint article generated more interest than I expected. I wanted to go into more detail when I wrote it but it got unwieldy. Unfortunately I didn’t get an opportunity due to various time constraints back then. The details would have required a lot of manual effort and I didn’t really want to deal with it.
But Wait, There’s More
Nonetheless, readers seemed to crave more! So I bit the bullet and examined every state highpoint and lowpoint, the distances between them and their resulting slopes. I estimated these values in two major systems of measurement, feet per mile and metres per kilometre. Then I used a Great Circle distance calculator on the Movable Type Scripts website. Finally I placed the results in a shared Google Spreadsheet available to the public. Feel free to sort it any way you like. You won’t break it.
I’ll begin with a few caveats. The latitudes and longitudes for state highpoints were rather straightforward and easy to obtain from numerous sources. So no issues there. The same could not be said for lowpoints. What exact point along a seacoast should I use? Where within Death Valley’s Badwater Basin should I plant the flag? How far up a tidal estuary for several eastern states did the water remain at sea level? I made a lot of best guesses without complete precision so readers should view data as approximate and relative. Others might run the same exercise and come up with figures slightly different although general rankings should remain similar. That’s a long way of saying you shouldn’t get too hung up on the implied precision of the spreadsheet.
How Graphic
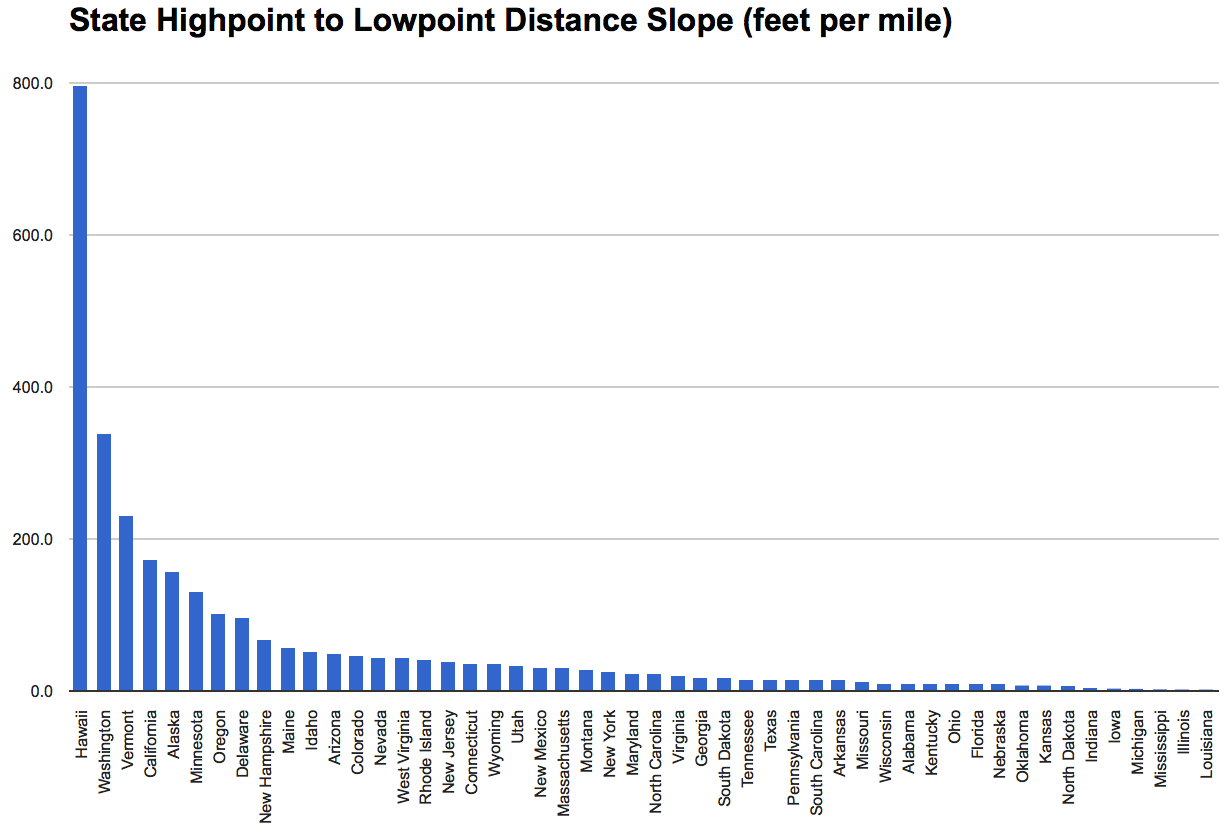
I took that same data and created a graph using the tool in Google Spreadsheets. Then I had to reduce the image to fit into the article. Readers can open it in another tab or window to see the original size if it’s too difficult to read.
Steepest Slope
Hawaii (overwhelmingly) and Washington demonstrated the greatest slope between highpoint and lowpoint, as referenced by reader Michael. Hawaii’s Mauna Kea was only about 17 miles (28 kilometers) from the ocean. This resulted in an amazing downward slope of nearly 800 feet per mile (150 m/km) from mountaintop to sea. That more than doubled the result created by Washington’s Mount Rainer to Puget Sound. Reader Scott offered that Vermont probably came in third place and my calculations confirmed his suggestion. Mount Mansfield to Lake Champlain descended at 230 ft/mi (44 m/km).
Farthest Absolute Distance
Reader Jacob wondered about the farthest absolute distances between state highpoint and lowpoint, as well as the opposite of what was just discussed, the smallest slope between the two points. Both were easy to discern once I created the spreadsheet.
I calculated the farthest distances in Texas and Oklahoma. Both extended greater than 500 miles (800 km). Interestingly, or possibly of interest only to me, Texas was the second largest state and had the longest distance between highpoint and lowpoint. In the earlier article I discovered that Delaware, the second smallest state, had the smallest distance between highpoint and lowpoint. That was an odd coincidence. It’s as if being in second place wasn’t good enough for either of them so they had to concoct a different superlative.
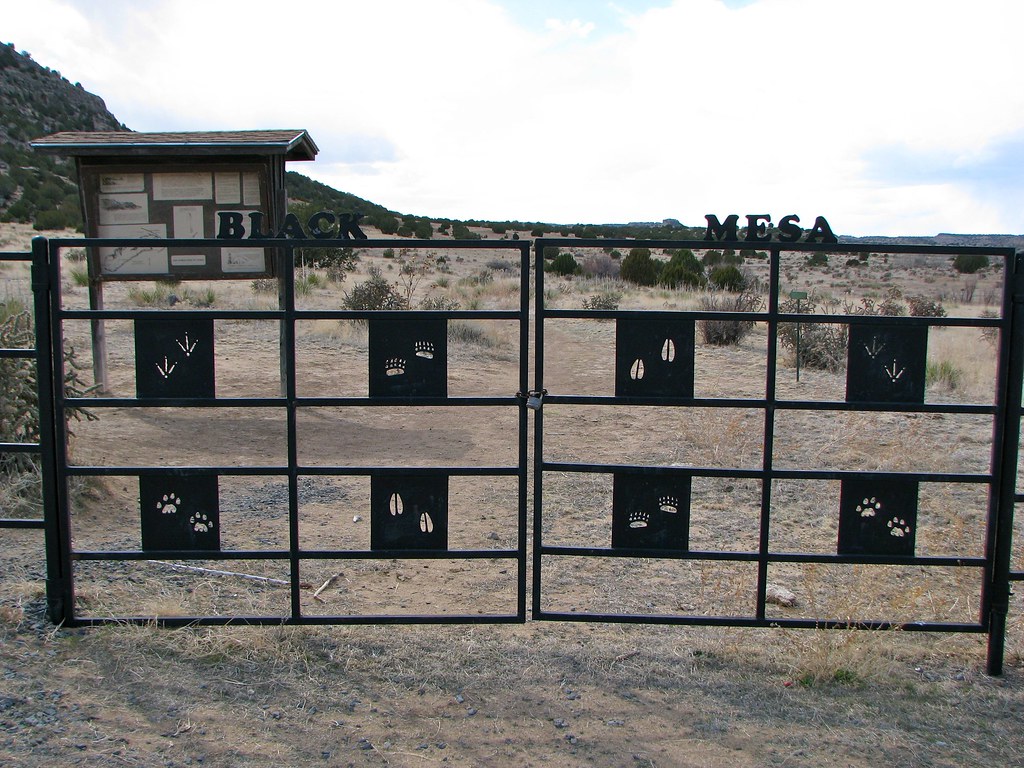
Nonetheless, I found Oklahoma more impressive than Texas for purposes of this exercise. The distances were nearly identical and yet Oklahoma was a much smaller state. Plus, I’ve actually been within close proximity to Oklahoma’s highpoint at Black Mesa when I undertook the Dust Bowl trip a couple of years ago. So I had a nice photo to illustrate the point and that was good enough for me.
Smallest Slope

The smallest slope actually surprised me. Louisiana won. Here the angle was created by an unusual situation. Specifically, the state’s lowpoint was below sea level in New Orleans so the regular method of drawing a line to the nearest seacoast wouldn’t work. Simultaneously the highpoint at Driskill Mountain wasn’t particularly high. Finally, it sat near the northwestern corner of the state, diagonally opposite of the lowpoint to maximized the distance. The downward slope equaled about 2.3 ft/mi (0.4 m/km). Two other states demonstrated slopes of less than 3 ft/mi: Illinois (I’ve been to that lowpoint) and Mississippi (been to that lowpoint too, it’s anywhere along its Gulf of Mexico shoreline).
Michigan came next at 3.5 ft/mi (0.7 m/km). I found that situation particularly fascinating in the context of the previous article where I noted the difference between the geographic placement of Minnesota and Michigan. Minnesota’s highpoint was located near Lake Superior, putting its highpoint and lowpoint in very close proximity. Michigan’s highpoint was also located near Lake Superior. However, the state of Michigan extended all the way down to Lake Erie. That made the distance between high and low 400+ miles (650 km) and placed it near the bottom of the slope list.
Projects for Another Day
Other readers came up with great ideas too. Peter suggested that I run a similar analysis for nations of the world. Rob wondered about the highpoints of one state that appeared to fall in close proximity to the lowpoints of another state. I didn’t have time to explore either of these today although I might if time permits or people seem interested.
Thank you all for the thoughts and suggestions.
Leave a Reply